What is GA4? A practical guide to Google Analytics 4
It’s no secret that the launch of Google Analytics 4 and the past few years of using it have been met with backlash. Initially designed to be a more immediately approachable data tool for business owners, it’s often been a confusing tool to make use of and while definitely more convenient than Universal Analytics, it can often be a struggle to get anything of use out of it. It is the most widely used traffic tracking tool in the world, and it is also one of the most widely ignored, largely because the interface assumes you already know what you are looking for.
This guide is designed to help break it all down. It covers what GA4 is actually for, how it is put together, which reports matter, and where the numbers deserve a second look. If you tried to understand everything in GA4, you’d be quickly lost in the numbers, so this is made specifically to provide you with the key insights you need.
What GA4 is for
At its simplest, GA4 tracks two things: traffic and leads. Who came to your website and what they did once they got there.
The obvious question is why you need a separate tool for that when your own systems already tell you how many enquiries came in. The answer is attribution. At its core, GA4 gives you visibility of where your traffic and your leads are coming from and where your time is best spent. The accuracy of that data is paramount and one of the bigger struggles when it comes to GA4 in particular.
Setting a GA4 account
Setting up GA4 means creating an account, then a property inside it, then a data stream inside that. In practice this all happens in a single wizard, and you can be through it in a few minutes.
The three layers do mean something, though:
-
- The account is the top-level container. It usually maps to a business, and one Google login can hold up to 100 of them.
-
- The property is the website itself, and this is where your data actually lives. An account can hold up to 2,000 properties, which is far more than most businesses will ever need. If you run multiple websites, multiple properties are worth setting up, but for most businesses, one account and one property will be fine.
-
- The data stream is the connection between your website and the property. You can have several in a property, but for a single website you only need one, and adding more usually creates more problems than it solves.
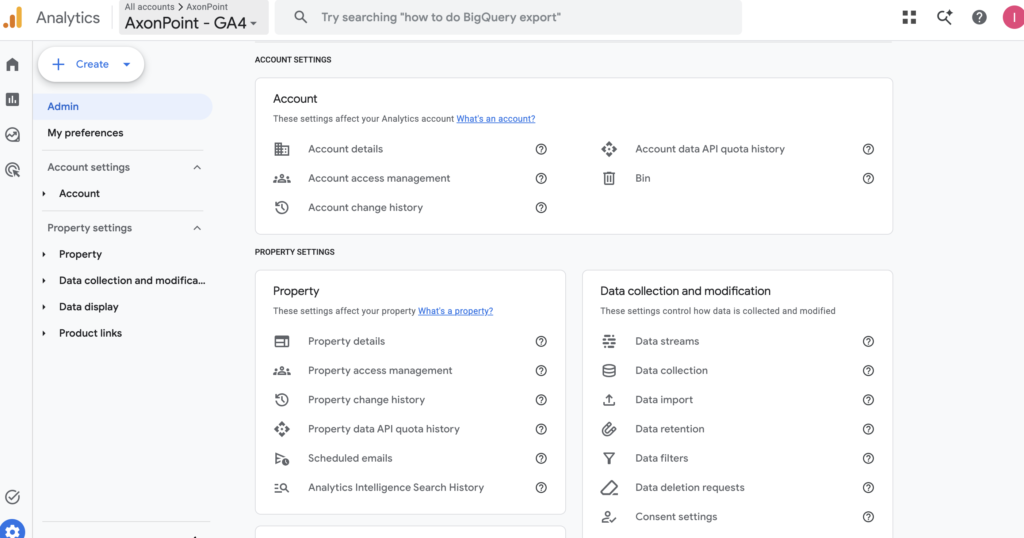
The setup wizard will give you installation instructions for most common platforms (such as Wix and WordPress), and following them is straightforward and easy enough for most sites. There is one setting worth changing before you walk away from it, which we cover in our guide to setting up GA4 properly.

Finding your way around GA4
GA4 has four main sections. Home gives you a snapshot when you log in. Reports holds your actual data. Explore lets you build custom reports once you know what you want. Advertising covers paid performance.

You will spend almost all of your time in Reports. Explore is powerful and worth learning eventually but it is only useful once you have a specific question you need answering. When you are just trying to understand your data, the generated reports will be fine.
There is also a real-time report, which shows a rolling 30-minute window of live activity. It sounds like the most exciting thing in GA4 but it is mostly a testing tool. Unless your site gets significant daily traffic, a half-hour window will show you a handful of visits and not much else. It comes into its own when you have set something up and want to check it is working.

Realtime report is also slow and occasionally unreliable. It can take a minute or two to refresh, and new events may not appear for a day or so. It is worth noting that the main reports also run one to two days behind as well. If something looks missing, it is usually not broken, it is just late.
Reading GA4 reports
The two reports you will use most are the user report and the traffic report. They look similar and they answer slightly different questions.
The user report counts users, meaning unique people. The traffic report counts sessions, meaning visits. One person visiting your site four times in a month is one user and four sessions, which is why the traffic report always looks healthier than the user report. Neither is more correct. They just measure different things, and most of the confusion around analytics reporting comes from two people quoting different metrics at each other without realising it.
The traffic report is the more detailed of the two by default, and it reports e-commerce data without you having to configure anything, so it tends to be the better starting point.
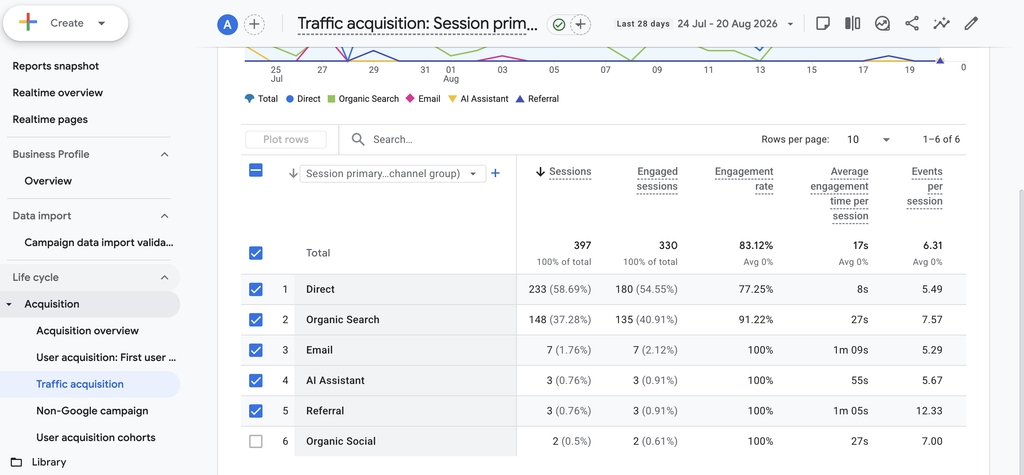
In each report, you can set a data range to your liking. The default is set to 28 days but you can view back as far as you want. You can also toggle a comparison. This is set by default to match day of the week, but you can change this and you can compare against the previous period, the previous year or a custom window if you prefer.

Both reports break performance down by channel:
-
- Organic search – clicks that came from Google, Bing or another search engine
-
- Direct – someone enters your site URL in the top bar
-
- Paid search – Google Ads and Microsoft Ads traffic
-
- Organic social – any social media activity
-
- Paid social – your paid social media efforts
-
- Referral – any clicks coming from external websites i.e. business listings or partner sites
-
- Email – any clicks from your emails. Most email tools will automatically set up this tracking for you
-
- AI assistant – any clicks from the various AI tools; i.e. ChatGPT, Gemini and Claude
-
- Unassigned – not as big a deal as it was at the beginning of GA4 but any traffic that can’t be assigned a channel. Most common when looking at the last 48 hours before traffic can be properly assigned.
Direct is the channel to treat with suspicion. In theory it means someone typed your address straight into their browser. In practice, changes to cookies and consent handling have turned it into a catch-all for anything GA4 cannot confidently attribute, which means a chunk of your direct traffic is really something else wearing a disguise. If you run Google Ads for example, it is not unusual to see a spike in direct traffic. It is still useful, but it is the last number you should build an argument on.

For anything more detailed, switching the report dimension to source and medium will show you what is actually driving each channel: Google and Bing under organic, Facebook and Instagram under social, and so on. You can do this by clicking on the dropdown box in the report like below.

Events and key events in GA4
Everything a visitor does on your site is recorded as an event. To view these, there is a events report in the reports section but we recommend using the Events section in GA4. This allows you to see your tracked events, events you have set up and your key events.

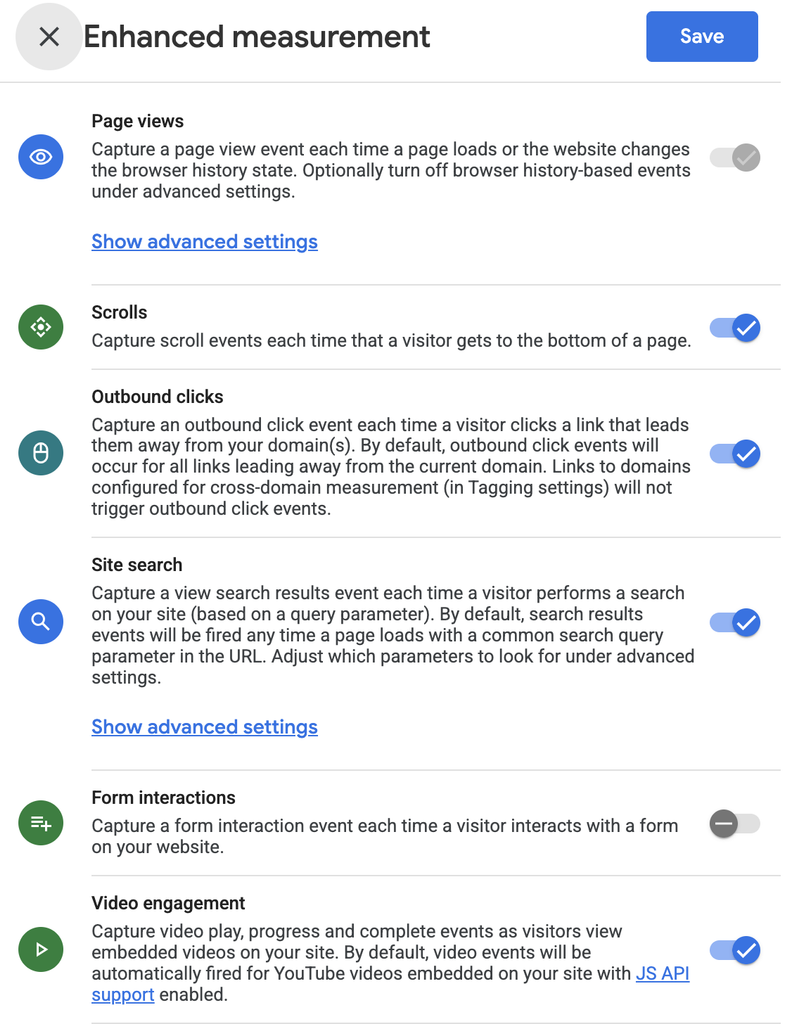
GA4 creates a set of these automatically, and most are self-explanatory: page views, scrolls, outbound clicks, file downloads. The main one we would recommend turning off is form tracking. It’s difficult to know what exactly it is tracking, and most forms simply can’t be tracked purely in GA4. For this, you will need to use Google Tag Manager or build something internally.
A key event is typically an event that acts as the end point for a user journey. Google used to call these goals, then conversions, and now key events, which is worth knowing purely so that older guides make sense. Typically these are form submissions, purchases, appointment bookings, and phone or email clicks. To mark a key event, you need to click the star next to it in the event menu in Settings.

Two things catch people out here.
The first is that GA4 no longer tracks phone and email clicks automatically. If those matter to your business, and they do for most local businesses, someone has to set them up.
The second is the delay. A new event will not appear in your list until a day or two after it first fires, which means setting one up is a two-part job: create it, then come back later to mark it as a key event. Skipping the second half is the single most common reason a business looks at its analytics and sees zero conversions.
It is also worth checking what is already in there. Some website platforms push their own events into GA4, and Google Ads can add its own and mark them as key events without asking. GA4 also now adds qualify_lead and close_convert_lead. You will want to remove these by unclicking the star as they won’t provide any data but they will make your key event report messier.

Connecting Google Business Profile to GA4
Under ‘Settings’, you will find Product Links, which connects your property to other Google tools. Most of these are optional, and Google explains them poorly. However, two are not optional.

Google Ads is the obvious one, and if you are spending money on ads, linking it is straightforward and should be a priority. Simply click it and then follow the instructions. You’ll want the Google Ads and Google Analytics accounts to be managed under the same Google account if possible.
Google Business Profile is the newer link and the more interesting one for local businesses. Once connected, GA4 generates a Business Profile report that mirrors much of your GBP performance data. The main advantage is history. GBP itself gives you a fairly short reporting window of 6 months, and in our own testing the linked GA4 report has held around 18 months of data, which makes year-on-year comparison much easier.

It is not a complete replacement. The report has no visibility data, so profile view counts still have to come from GBP directly, and if you link multiple locations, you get one combined view rather than the ability to look at each separately. Data is also lost daily as Google applies a strict 18-month window.
Still, for a local business, this is the closest thing to a free upgrade in the whole tool, and the sooner it is connected, the more history you will have when you need it.
Where GA4 stops
GA4 can track a reasonable amount on its own, but it has a hard ceiling. It handles page view events, outbound clicks, and form submissions that redirect to a thank-you page. It cannot handle forms that submit without a page change, which is most modern forms, and it cannot handle phone or email clicks or anything conditional.
For those, you need Google Tag Manager, which is a separate tool that sits between your website and GA4. Typically, Google Tag Manager is more dev-focused, but there are plenty of things you can do with minimal knowledge of code or web development.
How much should you trust GA4?
GA4 is not a source of truth. Tracking breaks, consent banners block data, attribution guesses, and a site change can quietly stop an event firing without anyone noticing for a month. Any number that has not been checked against something real should be treated as an indication rather than a fact.
The good news is that the numbers that matter most are usually the ones you can check. Form submissions, purchases and most appointment bookings are numbers that you will be aware of. Either in your site or through your CRM and other platforms. Click-to-calls and click-to-emails are harder to track, but you’ll know if the phone is ringing or not, and email enquiries are easy to check. These numbers are always advisory anyway, but validating them allows you to take away actual lessons from your data.
None of that makes GA4 less worth using but it does mean that you need to invest some time into properly understanding your data and making sure that what it is telling you is truthful. The buck doesn’t stop with GA4 and understanding that will allow you to make better-informed decisions about your business and your marketing.
GA4 tells you which part of your marketing worked. That is true, with one adjustment: it tells you which part of your marketing is working, in the way a weather forecast tells you what tomorrow looks like. Directionally reliable, occasionally wrong, and considerably better than guessing.
Set it up carefully, connect the things worth connecting, check the numbers you plan to act on, and it will earn its place. Log in once a quarter and read the totals without questioning them, and it will mostly tell you what you want to hear. If you want help setting up Google Analytics or better understanding your data, a member of our team will be happy to help, so please get in touch or feel free to read our other guides on Google Analytics.


